def grootte(nummer):
totaal = 0
lengte = [3, 3, 4, 4, 4, 4, 3, 5, 4, 5]
while(nummer > 0):
rest = nummer%10
nummer = nummer//10
totaal += lengte[rest]
return totaal
|
|
k = 2
L = []
zoeken = true
while zoeken:
for i in range(1, k+1):
for j in range(1, k-i+1):
if i/j >= 22:
if (3*i)%(3*j) != 0:
if grootte(3*i) == 2*grootte(3*j):
zoeken = false
if not L:
L.append(str(3*i)+"/"+str(3*j))
k += 1
L
['201/9'] ['201/9'] |
k = 22
L = []
zoeken = true
while zoeken:
for j in range(1, (k//22)+1):
for i in range(22*j, k-j+2):
if (3*i)%(3*j) != 0:
if grootte(3*i) == 2*grootte(3*j):
zoeken = false
if not L:
L.append(str(3*i)+"/"+str(3*j))
k += 22
L
['201/9'] ['201/9'] |
|
|
def kaprekar(nummer):
S = dict()
uitkomst = int("".join(sorted(str(nummer).zfill(5), reverse=True)))//10*10 - int("".join(sorted(str(nummer))))%10000
while uitkomst not in S or S[uitkomst] < 2:
if uitkomst not in S:
S[uitkomst] = 1
else:
S[uitkomst] = S[uitkomst] + 1
uitkomst = int("".join(sorted(str(uitkomst).zfill(5), reverse=True)))//10*10 - int("".join(sorted(str(uitkomst))))%10000
L = []
for i in S:
if S[i] > 1:
L.append(i)
return L
|
|
L = dict()
for i in range(10000, 100000):
if i != int(str(i)[::-1]):
for j in kaprekar(i):
if j not in L.keys():
L[j] = 0
else:
L[j] += 1
print(L)
meeste = 0
meestekey = 0
for key in L:
if L[key] > meeste:
meeste = L[key]
meestekey = key
print(str(meestekey) + ": " + str(meeste))
{96921: 15177, 95931: 40168, 94941: 14290, 97911: 19461}
95931: 40168
{96921: 15177, 95931: 40168, 94941: 14290, 97911: 19461}
95931: 40168
|
|
|
def perm(a, A):
B = copy(A)
ascii = ord(a) - 97
if ascii < 13:
for i in range(13):
j = i + ascii
if j >= 13:
j = j - 13
A[j] = B[i]
if ascii >= 13:
ascii = (ascii - 13)
for i in range(1, 7):
j = ascii + i
k = ascii - i
if j > 12:
j = j - 13
if k < 0:
k = k + 13
A[j] = B[k]
A[k] = B[j]
return A
|
|
def dertienhoek(tekst):
A = [i for i in range(13)]
L = list("".join(tekst.split()).lower())
for let in L:
A = perm(let, A)
return A
|
|
dertienhoek("Met wiskunde kunnen we allerlei rare dingen doen zoals volledige teksten reduceren tot een letter")
[3, 2, 1, 0, 12, 11, 10, 9, 8, 7, 6, 5, 4] [3, 2, 1, 0, 12, 11, 10, 9, 8, 7, 6, 5, 4] |
dertienhoek("v")
[3, 2, 1, 0, 12, 11, 10, 9, 8, 7, 6, 5, 4] [3, 2, 1, 0, 12, 11, 10, 9, 8, 7, 6, 5, 4] |
|
|
def rec_kans(i, p1, p2):
if i == 1:
return 1
else:
return kans(rec_kans(i-1, p1, p2), p1, p2)
|
|
def kans(Bi, p1, p2):
return Bi*p1 + (1-Bi)*p2
|
|
def samenstelling(B, C):
return (0.4)*(B*C)+(0.6)*(1-(1-B)*(1-C))
|
|
samenstelling(rec_kans(10, 0.5, 0.3), rec_kans(10, 0.2, 0.4))
0.399999991466688 0.399999991466688 |
|
|
lastValue = 2
while (lastValue < 10^12):
lastValue = find_root(x^2-lastValue*5*x + lastValue^2+5, lastValue+1, 10^14)
print("%.1f" % lastValue)
9.0
43.0
206.0
987.0
4729.0
22658.0
108561.0
520147.0
2492174.0
11940723.0
57211441.0
274116482.0
1313370969.0
6292738363.0
30150320846.0
144458865867.0
692144008489.0
3316261176578.0
9.0 43.0 206.0 987.0 4729.0 22658.0 108561.0 520147.0 2492174.0 11940723.0 57211441.0 274116482.0 1313370969.0 6292738363.0 30150320846.0 144458865867.0 692144008489.0 3316261176578.0 |
|
|
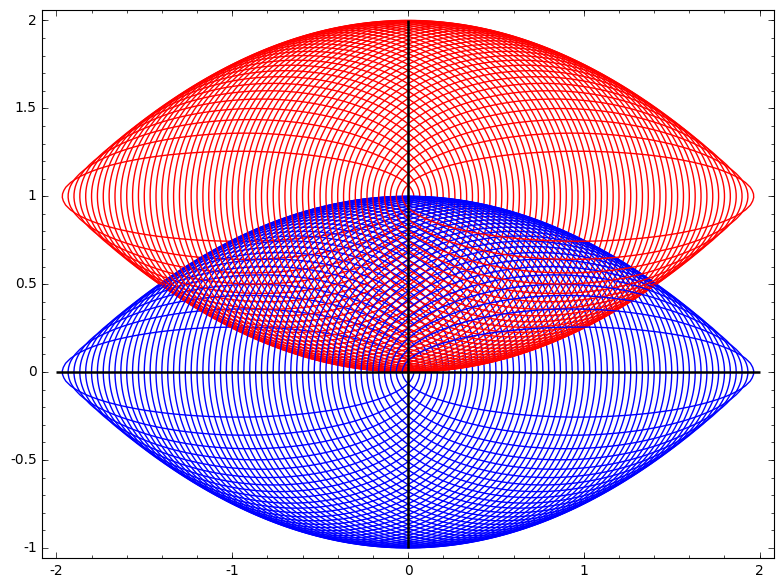
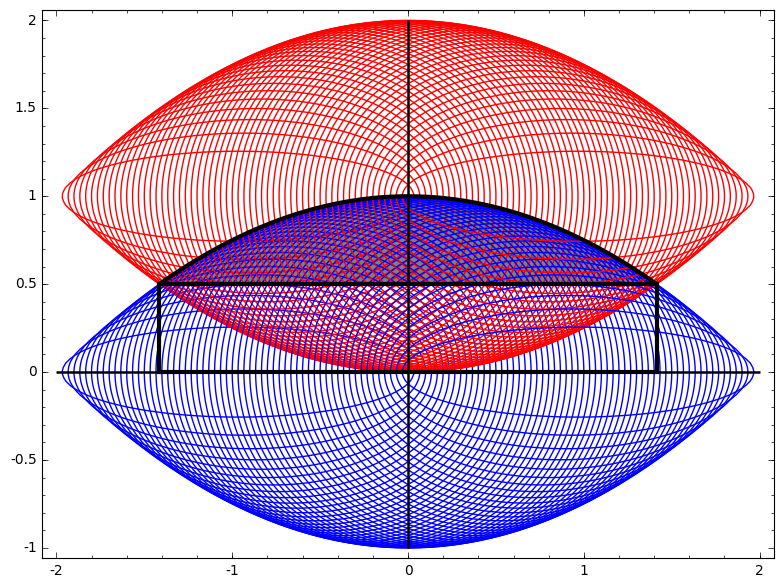
var('a,x,y')
P = polygon([0,0])
for a in srange(-2, 2, step = 1/15):
P+=implicit_plot(sqrt(x^2 + y^2) + sqrt((x-a)^2 + y^2) - 2, (x,-2,2), (y,-1, 2))
P+=implicit_plot(sqrt(x^2 + (y-1)^2) + sqrt((x-a)^2 + (y-1)^2) - 2, (x,-2,2), (y,-1, 2), color = 'red')
P+=implicit_plot(x, (x,-2,2), (y,-1, 2), color = 'black', linewidth = 1.8)
P+=implicit_plot(y, (x,-2,2), (y,-1, 2), color = 'black', linewidth = 1.8)
P
/opt/sage/sage-7.4/local/lib/python2.7/site-packages/matplotlib/font_man\
ager.py:273: UserWarning: Matplotlib is building the font cache using
fc-list. This may take a moment.
  warnings.warn('Matplotlib is building the font cache using fc-list.
This may take a moment.')
/opt/sage/sage-7.4/local/lib/python2.7/site-packages/matplotlib/font_manager.py:273: UserWarning: Matplotlib is building the font cache using fc-list. This may take a moment.
  warnings.warn('Matplotlib is building the font cache using fc-list. This may take a moment.')
|
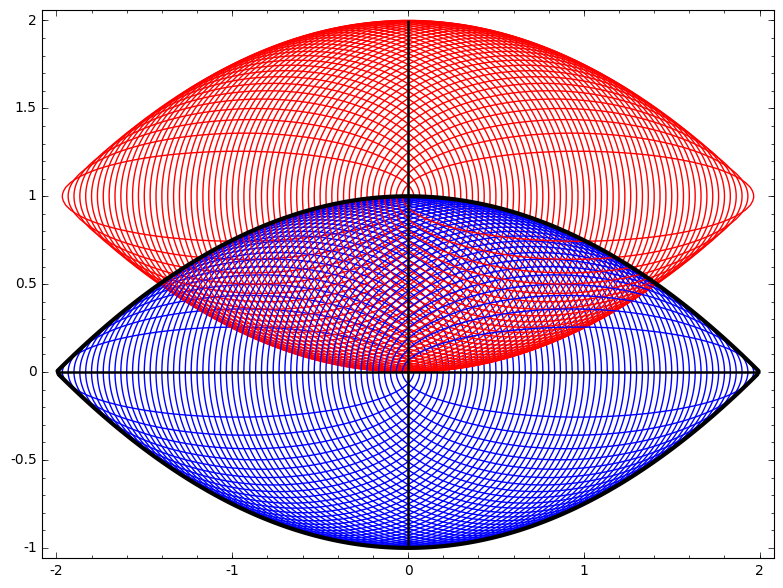
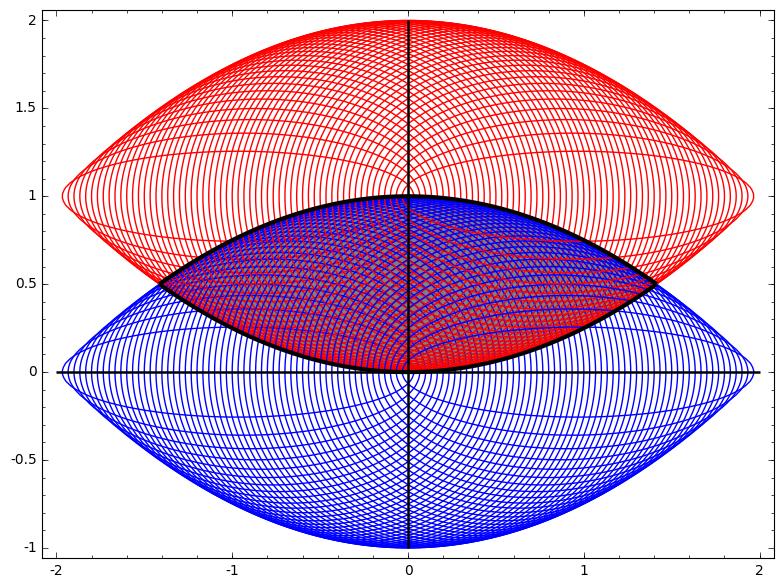
f(x,y,a) = sqrt(x^2 + y^2) + sqrt((x-a)^2 + y^2) - 2
print(solve(f(x,y,a).diff(a), a)[0])
g(x,y) = sqrt(x^2 + y^2) + sqrt(y^2) - 2
g(x,y)
a == x
sqrt(x^2 + y^2) + sqrt(y^2) - 2
a == x sqrt(x^2 + y^2) + sqrt(y^2) - 2 |
G=P+implicit_plot(g(x,y), (x,-2,2), (y,-1, 2), color = 'black', linewidth = 3)
G
|
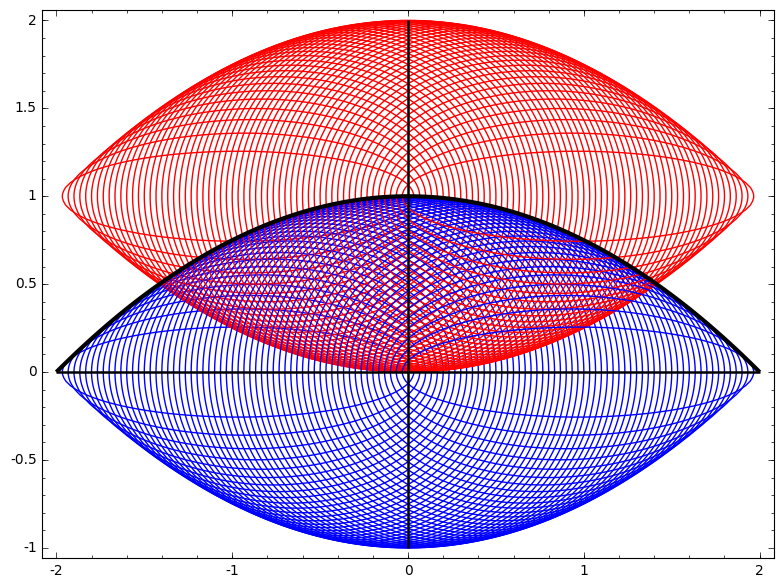
h = (4-x^2)/4
h
-1/4*x^2 + 1 -1/4*x^2 + 1 |
J=P+implicit_plot(h-y, (x,-2,2), (y,-1, 2), color = 'black', linewidth = 3)
J
|
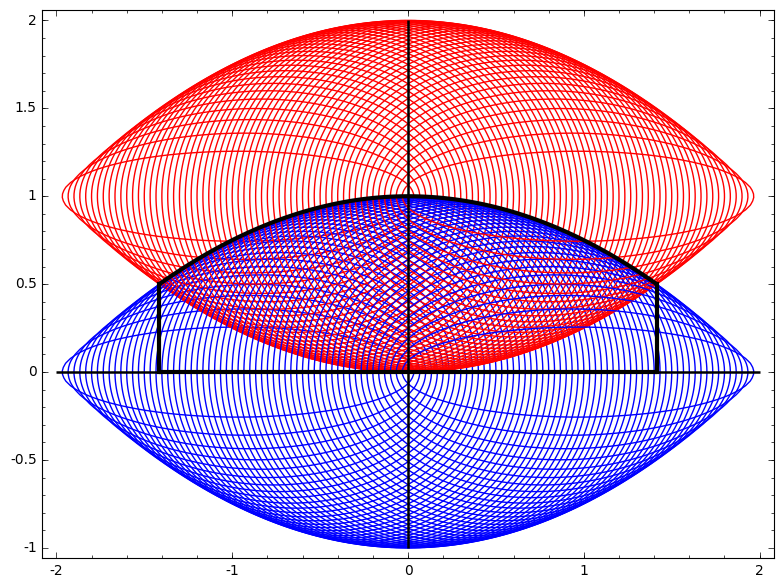
print(solve(h - 1/2, x)[0])
print(solve(h - 1/2, x)[1])
h.integral(x, -sqrt(2), sqrt(2)).n()
x == -sqrt(2)
x == sqrt(2)
2.35702260395516
x == -sqrt(2) x == sqrt(2) 2.35702260395516 |
from sage.plot.colors import gray
H=P+implicit_plot(h-y, (x,-sqrt(2),sqrt(2)), (y,0, 2), color = 'black', linewidth = 3)
H+=implicit_plot(y, (x,-sqrt(2),sqrt(2)), (y,-1, 2), color = 'black', linewidth = 3)
H+=line([(sqrt(2),0), (sqrt(2),1/2)], rgbcolor = (0,0,0), thickness = 3)
H+=line([(-sqrt(2),0), (-sqrt(2),1/2)], rgbcolor = (0,0,0), thickness = 3)
#H+=plot(1/2,(x,-sqrt(2),sqrt(2)),fill=h, color = 'yellow', fillcolor = 'black', thickness = 0)
#H+=polygon([(-sqrt(2),0), (-sqrt(2),1/2), (sqrt(2),1/2), (sqrt(2),0)], rgbcolor = gray.rgb())
H
|
(h.integral(x, -sqrt(2), sqrt(2))-sqrt(2)).n()
0.942809041582063 0.942809041582063 |
L=P+implicit_plot(y-1/2, (x,-sqrt(2),sqrt(2)), (y,0,1), color = 'black', linewidth = 3)
L+=implicit_plot(h-y, (x,-sqrt(2),sqrt(2)), (y,0, 2), color = 'black', linewidth = 3)
L+=implicit_plot(y, (x,-sqrt(2),sqrt(2)), (y,-1, 2), color = 'black', linewidth = 3)
L+=line([(sqrt(2),0), (sqrt(2),1/2)], rgbcolor = (0,0,0), thickness = 3)
L+=line([(-sqrt(2),0), (-sqrt(2),1/2)], rgbcolor = (0,0,0), thickness = 3)
L+=plot(1/2,(x,-sqrt(2),sqrt(2)),fill=h, color = 'yellow', fillcolor = 'black', thickness = 0)
L
|
2*(h.integral(x, -sqrt(2), sqrt(2))-sqrt(2)).n()
1.88561808316413 1.88561808316413 |
Q=P+implicit_plot(h-y, (x,-sqrt(2),sqrt(2)), (y,0, 2), color = 'black', linewidth = 3)
Q+=implicit_plot(-h-y+1, (x,-sqrt(2),sqrt(2)), (y,0, 1), color = 'black', linewidth = 3)
Q+=plot(1/2,(x,-sqrt(2),sqrt(2)),fill=h, color = 'yellow', fillcolor = 'black', thickness = 0)
Q+=plot(1/2,(x,-sqrt(2),sqrt(2)),fill=-h+1, color = 'yellow', fillcolor = 'black', thickness = 0)
Q
|
|
|
def bewerking(P, Q):
S = Q*P + P*Q
for i in range(5):
for j in range(5):
if i == j:
S[i,j] = 0
return S
|
|
W = Graph({1:[2,2],2:[],3:[],4:[],5:[]})
A = matrix(QQ, 5, 5, [[0,1,0,0,0],[1,0,0,0,0],[0,0,0,0,0],[0,0,0,0,0],[0,0,0,0,0]])
print(matrix(QQ, 5, 5, A))
W.plot().show()
[0 1 0 0 0]
[1 0 0 0 0]
[0 0 0 0 0]
[0 0 0 0 0]
[0 0 0 0 0]
[0 1 0 0 0] [1 0 0 0 0] [0 0 0 0 0] [0 0 0 0 0] [0 0 0 0 0] 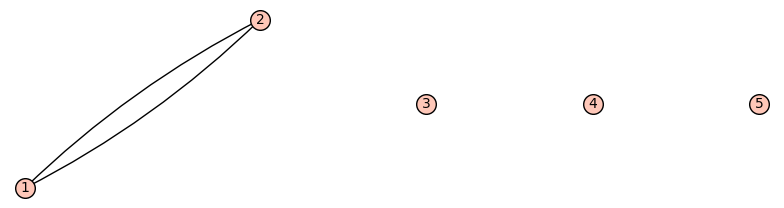
|
bewerking(A, A)
[0 0 0 0 0] [0 0 0 0 0] [0 0 0 0 0] [0 0 0 0 0] [0 0 0 0 0] [0 0 0 0 0] [0 0 0 0 0] [0 0 0 0 0] [0 0 0 0 0] [0 0 0 0 0] |
X = Graph({1:[2],2:[],3:[4],4:[],5:[]})
A = matrix(QQ, 5, 5, [[0,1,0,0,0],[1,0,0,0,0],[0,0,0,0,0],[0,0,0,0,0],[0,0,0,0,0]])
B = matrix(QQ, 5, 5, [[0,0,0,0,0],[0,0,0,0,0],[0,0,0,1,0],[0,0,1,0,0],[0,0,0,0,0]])
X.set_edge_label(1, 2, 'Matrix A')
X.set_edge_label(3, 4, 'Matrix B')
print(matrix(QQ, 5, 5, A))
print
print(matrix(QQ, 5, 5, B))
X.plot(edge_labels = True).show()
[0 1 0 0 0] [1 0 0 0 0] [0 0 0 0 0] [0 0 0 0 0] [0 0 0 0 0] [0 0 0 0 0] [0 0 0 0 0] [0 0 0 1 0] [0 0 1 0 0] [0 0 0 0 0] [0 1 0 0 0] [1 0 0 0 0] [0 0 0 0 0] [0 0 0 0 0] [0 0 0 0 0] [0 0 0 0 0] [0 0 0 0 0] [0 0 0 1 0] [0 0 1 0 0] [0 0 0 0 0] 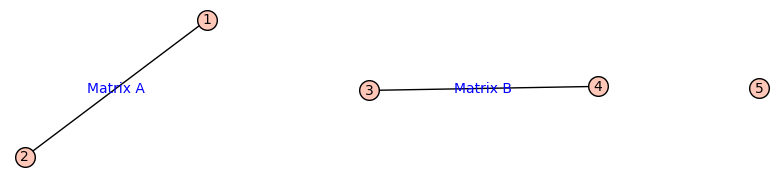
|
bewerking(A, B)
[0 0 0 0 0]
[0 0 0 0 0]
[0 0 0 0 0]
[0 0 0 0 0]
[0 0 0 0 0]
[0 0 0 0 0] [0 0 0 0 0] [0 0 0 0 0] [0 0 0 0 0] [0 0 0 0 0] |
Y = Graph({1:[2,3],2:[],3:[],4:[],5:[]})
A = matrix(QQ, 5, 5, [[0,1,0,0,0],[1,0,0,0,0],[0,0,0,0,0],[0,0,0,0,0],[0,0,0,0,0]])
B = matrix(QQ, 5, 5, [[0,0,1,0,0],[0,0,0,0,0],[1,0,0,0,0],[0,0,0,0,0],[0,0,0,0,0]])
Y.set_edge_label(1, 2, 'Matrix A')
Y.set_edge_label(1, 3, 'Matrix B')
print(matrix(QQ, 5, 5, A))
print
print(matrix(QQ, 5, 5, B))
Y.plot(edge_labels = True).show()
[0 1 0 0 0]
[1 0 0 0 0]
[0 0 0 0 0]
[0 0 0 0 0]
[0 0 0 0 0]

[0 0 1 0 0]
[0 0 0 0 0]
[1 0 0 0 0]
[0 0 0 0 0]
[0 0 0 0 0]
[0 1 0 0 0] [1 0 0 0 0] [0 0 0 0 0] [0 0 0 0 0] [0 0 0 0 0] [0 0 1 0 0] [0 0 0 0 0] [1 0 0 0 0] [0 0 0 0 0] [0 0 0 0 0] 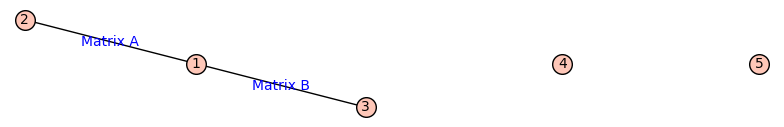
|
print(bewerking(A, B))
Z = Graph({1:[2,3],2:[3],3:[],4:[],5:[]})
Z.set_edge_label(1, 2, 'Matrix A')
Z.set_edge_label(1, 3, 'Matrix B')
Z.set_edge_label(2, 3, 'A * B')
Z.plot(edge_labels = True).show()
[0 0 0 0 0]
[0 0 1 0 0]
[0 1 0 0 0]
[0 0 0 0 0]
[0 0 0 0 0]
[0 0 0 0 0] [0 0 1 0 0] [0 1 0 0 0] [0 0 0 0 0] [0 0 0 0 0] 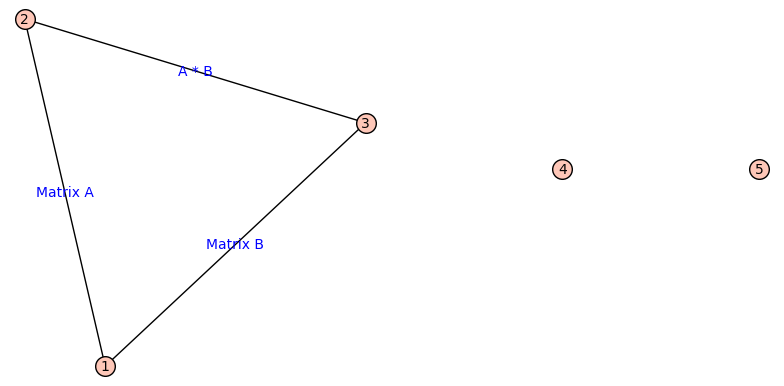
|
def rec_matrix(B, i, j, A, k, S):
min = 2
if i == 4 and j == 5:
if k == min:
S.append(bewerking(A, matrix(QQ, 5, 5, B)))
return S
else:
B[i][j] = 0
B[j][i] = 0
if j == 4:
i += 1
j = i+1
else:
j += 1
S = rec_matrix(B, i, j, A, k, S)
if k != min:
if j == i+1:
i -= 1
j = 4
else:
j -= 1
B[i][j] = 1
B[j][i] = 1
if j == 4:
i += 1
j = i+1
else:
j += 1
k += 1
S = rec_matrix(B, i, j, A, k, S)
return S
|
|
def matrix_clean(L):
maxg = 0
for M in L:
maxl = 0
for i in range(5):
for j in range(i+1, 5):
if M[i,j] == 0:
maxl += 1
else:
M[i,j] = 1
M[j,i] = 1
if maxl > maxg:
maxg = maxl
while M in L:
L.remove(M)
L.append(M)
for M in L:
maxl = 0
for i in range(5):
for j in range(i+1, 5):
if M[i,j] == 0:
maxl += 1
if maxl < maxg:
while M in L:
L.remove(M)
return L
|
|
def split(A):
B = [[0 for i in range(5)] for j in range(5)]
return matrix_clean(rec_matrix(B, 0, 1, A, 0, []))
|
|
def check(L):
K = []
for M in matrix_clean(L):
for N in split(M):
K.append(N)
L = matrix_clean(K)
if matrix(QQ, 5, 5, [[0 for i in range(5)] for j in range(5)]) in L:
return [L, True]
else:
return [L, False]
|
|
A = [matrix(QQ, 5, 5, [[1 for i in range(5)] for j in range(5)]) - diagonal_matrix([1 for i in range(5)])]
bool = False
while not bool:
tuple = check(A)
A = tuple[0]
bool = tuple[1]
print bool
False
False
False
False
True
False False False False True |
|
|
naarCoord = [[3,1],[1,1],[3,3],[1,3],
[-1,3],[-1,1],[-3,3],[-3,1],
[-3,-1],[-1,-1],[-3,-3],[-1,-3],
[1,-3],[1,-1],[3,-3],[3,-1]]
|
|
def driehoeken():
aantal = 0
checked = 0
coord = [[] for i in range(5)]
for i in range(16):
coord[0] = naarCoord[i]
for j in range(i+1, 16):
coord[1] = naarCoord[j]
for k in range(j+1, 16):
coord[2] = naarCoord[k]
for l in range(k+1, 16):
coord[3] = naarCoord[l]
for m in range(l+1, 16):
coord[4] = naarCoord[m]
checked += 1
if omtrekGrootte(coord) ==3:
aantal +=1
print("checked: " + str(checked))
return aantal
|
|
def omtrekGrootte(gesorteerdeCoord):
inOmtrek = []
omtrekSize = 0
for coord in gesorteerdeCoord:
if omtrekSize >= 2 and buiten(inOmtrek[omtrekSize-1], inOmtrek[omtrekSize-2], coord):
inOmtrek[omtrekSize-1] = coord
else:
inOmtrek.append(coord)
omtrekSize += 1
while (len(inOmtrek) > 1 and buiten(inOmtrek[len(inOmtrek)-1], inOmtrek[0], inOmtrek[1])):
omtrekSize -= 1
inOmtrek.remove(inOmtrek[len(inOmtrek)-1])
if (omtrekSize == 3):
for i in range(3):
j = (i+1)%3
if (((inOmtrek[i][0] != inOmtrek[j][0]) and (inOmtrek[i][1]-inOmtrek[j][1])/(inOmtrek[i][0]-inOmtrek[j][0])*(-inOmtrek[i][0])-(-inOmtrek[i][1]) == 0) or ((inOmtrek[i][0]==inOmtrek[j][0]) and (inOmtrek[i][0] == 0))):
omtrekSize = 0
return omtrekSize
|
|
def buiten(coord1, coord2, coord3):
return ((coord1[0]!=coord2[0]) and ((((coord1[1]-coord2[1])/(coord1[0]-coord2[0])*(coord3[0]-coord1[0])-(coord3[1]-coord1[1]) < 0) == (coord1[0]-coord2[0] > 0)) or ((coord1[1]-coord2[1])/(coord1[0]-coord2[0])*(coord3[0]-coord1[0])-(coord3[1]-coord1[1]) == 0))) or ((coord1[0]==coord2[0]) and (coord1[0]<coord3[0]) == (coord1[1]-coord2[1] < 0))
|
|
driehoeken()
checked: 4368
658
checked: 4368 658 |
factorial(16)/(factorial(11)*factorial(5))
4368 4368 |
from itertools import combinations
p = [(i, j) for i in [0 .. 3] for j in [0 .. 3]]
c = 0
n = 48
for j, comb in enumerate(combinations(p, 5)):
poly = Polyhedron(comb, base_ring=QQ)
if len(poly.vertices()) == 3 and all((1.5 + 0.001*sin(a*2*pi/n), 1.5 + 0.001*cos(a*2*pi/n)) in poly for a in range(n)):
# (poly.plot() + point((1.5,1.5), color="red", zorder=10, size=100)).show(xmin=0, xmax=3, ymin=0, ymax=3, axes=False, frame=True)
c += 1
if j%100 == 0:
print j
print "done", c
0
100
200
300
400
500
600
700
800
900
1000
1100
1200
1300
1400
1500
1600
1700
1800
1900
2000
2100
2200
2300
2400
2500
2600
2700
2800
2900
3000
3100
3200
3300
3400
3500
3600
3700
3800
3900
4000
4100
4200
4300
done 272
0 100 200 300 400 500 600 700 800 900 1000 1100 1200 1300 1400 1500 1600 1700 1800 1900 2000 2100 2200 2300 2400 2500 2600 2700 2800 2900 3000 3100 3200 3300 3400 3500 3600 3700 3800 3900 4000 4100 4200 4300 done 272 |
28.0024615607099 + 0.756279967441601 + 0.264837022361628
29.0235785505131 29.0235785505131 |
from sage.symbolic.integration.integral import definite_integral
P = polygon([0,0])
n = 40
L = []
SL = []
C = []
for i in range(n+1):
sol = circlecurve([i/n,0], [1/2,(i*sqrt(3)/2)/n], [1/2+cos(2*pi*i/n).n()*sqrt(3)/6,sqrt(3)/6+sin(2*pi*i/n).n()*sqrt(3)/6])
L.append( piecewise( [ [ ( -0.5, sol[1][a]-sol[1][r] ), lambda x: 1 ] , [ [ sol[1][a]-sol[1][r], sol[1][a]+sol[1][r] ], lambda x: -sqrt(sol[1][r]**2-(x-sol[1][a])**2)+sol[1][b] ], [ ( sol[1][a]+sol[1][r], 7 ) , lambda x: 1] ] ) )
if i == 0 or i == n:
P += circle((sol[1][a],sol[1][b]),sol[1][r], color='black')
C += sol
c1 = ((x-C[1][a])^2+(y-C[1][b])^2==C[1][r]^2)
c2 = ((x-C[3][a])^2+(y-C[3][b])^2==C[3][r]^2)
uc1 = sqrt(C[1][r]^2-(x-C[1][a])^2)+C[1][b]
lc1 = -sqrt(C[1][r]^2-(x-C[1][a])^2)+C[1][b]
lc2 = -sqrt(C[3][r]^2-(x-C[3][a])^2)+C[3][b]
s12 = solve([c1, c2],x,y, solution_dict=True)
for j in range((ZZ)(0.75*n)):
SL.append((0.46+j/n, lowest(L, 1, n-1, 0.46+j/n)))
S = spline(SL)
print("Grote cirkel: ", (pi*C[3][r]^2).n())
print("Kleine cirkel: ", (definite_integral(uc1,x,C[1][a]-C[1][r],s12[0][x]) - definite_integral(lc1,x,C[1][a]-C[1][r],0) - definite_integral(lc1,x,0,0.46)).n())
print("\"Driehoekje\": ", definite_integral(lc2,x,s12[0][x],1).n())
print("Curve onder de as: ", (definite_integral(lc2,x,1,1.2) - S.definite_integral(0.46, 1.2)).n())
print("Totaal: ", ((pi*C[3][r]^2)+(definite_integral(uc1,x,C[1][a]-C[1][r],s12[0][x])-definite_integral(lc1,x,C[1][a]-C[1][r],0)-definite_integral(lc1,x,0,0.46))+definite_integral(lc2,x,s12[0][x],1)+(definite_integral(lc2,x,1,1.2)-S.definite_integral(0.46, 1.2))).n())
P += point([0, 0])
P += point([0.46, SL[0][1]])
P += point([s12[1][x], s12[1][y]])
P += list_plot(SL, plotjoined=True, color='black')
P+=plot(1.23, (x,0.39,1.21), color='black', fillcolor = 'black', fill=lc2)
P.show(xmin = -0.4, xmax = 1.2, ymin = -0.25, ymax = 1.2)
P+=plot(0, (x,C[1][a]-C[1][r],s12[0][x]), color='black', fillcolor = 'black', fill=uc1)
P.show(xmin = -0.4, xmax = 1.2, ymin = -0.25, ymax = 1.2)
P+=plot(0, (x,C[1][a]-C[1][r],0), color='black', fillcolor = 'white', fill=lc1)
P.show(xmin = -0.4, xmax = 1.2, ymin = -0.25, ymax = 1.2)
P+=plot(0, (x,0,0.46), color='black', fillcolor = 'black', fill=lc1)
P.show(xmin = -0.4, xmax = 1.2, ymin = -0.25, ymax = 1.2)
P+=plot(0, (x,s12[0][x],1), color='black', fillcolor = 'black', fill=lc2)
P.show(xmin = -0.4, xmax = 1.2, ymin = -0.25, ymax = 1.2)
P+=plot(0, (x,0.46, 1.21), color='black', fillcolor = 'black', fill=S)
P.show(xmin = -0.4, xmax = 1.2, ymin = -0.25, ymax = 1.2)
P+=plot(0, (x,1, 1.21), color='black', fillcolor = 'white', fill=lc2)
P.show(xmin = -0.4, xmax = 1.2, ymin = -0.25, ymax = 1.2)
('Grote cirkel: ', 28.0024615607099)
('Grote cirkel: ', 28.0024615607099)
|
def circlecurve(pta, ptb, ptc):
a=var('a')
b=var('b')
r=var('r')
var('x ,y')
circ=(x-a)^2+(y-b)^2==r^2
eq1 = circ.subs(x==pta[0]).subs(y==pta[1])
eq2 = circ.subs(x==ptb[0]).subs(y==ptb[1])
eq3 = circ.subs(x==ptc[0]).subs(y==ptc[1])
sol = solve([eq1,eq2,eq3],a,b,r, solution_dict=True)
return sol
|
|
def lowest(L, p, n, x):
if n >= 0:
p = lowest(L, p, n-1, x)
if L[n+1](x) < p:
return L[n+1](x)
return p
|
|
|
|